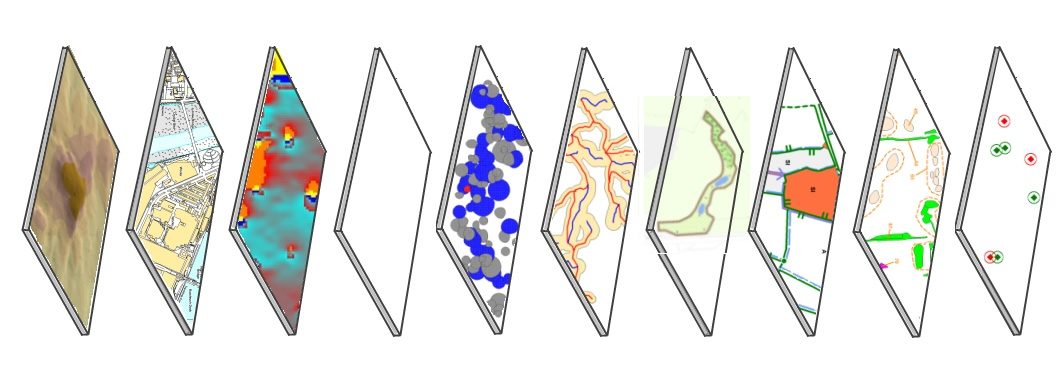
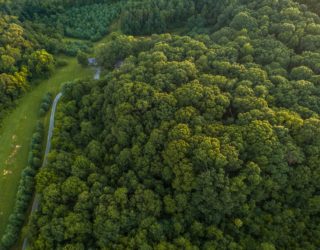
Capturing data is just part of the Thomson GIS and Mapping Team’s capability – for our customers the real value comes in the analysis and visualisation of that data!
We can use data to create complex models using AI and machine learning for site identification and predictive ecology models.
We can visualise data in new and exciting ways to make it more easily understood and we can present it back to clients through engaging web pages as well as more traditional documents.
We can turn our tree surveys into interactive 3D models and give users access to them to show the impact of tree planting or to model change over time or assess views into or out of sites.
We undertake advanced data analysis to solve a wide range of environmental problems. We use spatial tools to:
Carry out Natural Capital and Biodiversity Analysis
Assess the proximity of a development to sites of ecological importance and protected species
Calculate areas of habitat loss and gain of a development to fulfil EPSL requirements
Create ecological balance sheets for developments to identify the requirements for biodiversity offsetting
Conduct collision risk analysis for birds and wind farms
Identify potential mitigation sites for species with given habitat characteristics such as nightingales, badgers and water voles.
We also use the 3D capabilities of GIS to visualise our project data and give us additional perspectives of our sites and proposed solutions. For example, the multidimensional views and tools provide robust techniques to model the population distribution and density of species across a study area to identify hotspots requiring careful management or clear areas most suited to development.
